glm-usage-monitor
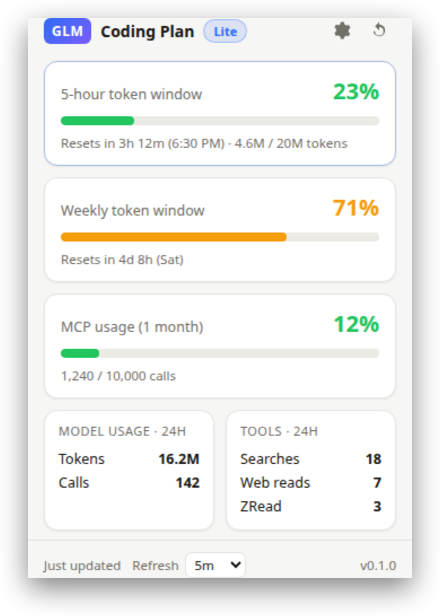 The 5-hour and weekly token windows · monthly MCP quota · reset countdowns ·
24-hour model & tool usage — with a color-coded toolbar badge. The live usage
monitor `claude-monitor.com` gives Claude users, for the **GLM Coding Plan**.
The 5-hour and weekly token windows · monthly MCP quota · reset countdowns ·
24-hour model & tool usage — with a color-coded toolbar badge. The live usage
monitor `claude-monitor.com` gives Claude users, for the **GLM Coding Plan**.
Why
If you use GLM via Claude Code (or any Coding Plan client) and missed having a live usage badge, this is for you. The extension reads your own usage from the official Z.AI / ZHIPU monitor API and shows it one click away.
The one catch: the Claude monitor needs no key — it rides your
claude.aisession cookie. GLM’s usage API is not cookie-authed: it requires anAuthorization: <token>header with your Coding Plan key. So you paste that key once, and it never leaves your device except to authenticate your own usage requests. See SECURITY.md for the full threat model.
Features
- Toolbar badge — live 5-hour token-window %, color-coded green / amber / red.
- 5-hour token window — %, progress bar, reset countdown, and token spend.
- Weekly token window — %, progress bar, and reset time.
- Monthly MCP usage — % and calls used / total.
- 24-hour model usage — tokens consumed and call count.
- 24-hour tool usage — web searches, web reads, ZRead calls.
- Settings — paste your key, choose the platform, set the refresh interval (1–30 min), and Test connection before saving.
- Resilient — exponential auth-backoff grays the badge on repeated 401/403,
and defensive parsing degrades a changed field to
—instead of crashing.
Install
From the Chrome Web Store (recommended)
Once published: open the listing in Brave / Chrome / Edge → Add to …, then open the extension → Settings → paste your key.
(Listing link will be added here once the extension is live.)
Load unpacked (for contributors / pre-release)
- Open your browser’s extensions page and enable Developer mode
(Brave
brave://extensions· Chromechrome://extensions· Edgeedge://extensions). - Load unpacked → select the repo root (the folder with
manifest.json). - Pin the GLM Usage icon to your toolbar.
Set up your key
- Open the extension → ⚙ Settings.
- Paste your GLM Coding Plan API key — the same value you set as
ANTHROPIC_AUTH_TOKENwhen running Claude Code against GLM. Find it in your Z.AI dashboard under API Keys / Coding Plan. - Platform — leave Z.AI — Global (
api.z.ai) unless your account is on the China platform, then pick ZHIPU (open.bigmodel.cn). - Test connection — you should see
Connected — plan <tier>, 5h …%, weekly …%. - Save. The badge updates within a few seconds.
How it works
A Manifest V3 service worker polls the monitor API on a timer and persists a
normalized snapshot to chrome.storage.local; the popup just renders that
snapshot. All values are written with .textContent, never innerHTML, so a
malformed or hostile response cannot inject markup.
Three read-only GET endpoints are used (Auth header = your key, no Bearer
prefix):
| Endpoint | Provides |
|---|---|
/api/monitor/usage/quota/limit |
5h %, weekly %, MCP %, plan tier, reset times |
/api/monitor/usage/model-usage?startTime&endTime |
24h tokens + call count |
/api/monitor/usage/tool-usage?startTime&endTime |
24h search / read / ZRead counts |
Privacy & security
- Your key lives only in
chrome.storage.localon your device. - It is sent only to the six monitor URLs in
manifest.json— never to a third party, analytics, or ad network. - Permissions are minimal:
storage,alarms, and the read-only monitor paths. Nocookies,tabs,<all_urls>, content scripts, orexternally_connectable.
Full details: SECURITY.md · Privacy Policy
Troubleshooting
- Badge shows
?(gray) — no key yet, or no usage data yet. Open Settings and add / test your key. - “Authentication failed (401/403)” — the key was rejected. Check it is a Coding Plan key and that the Platform matches your account.
- “Z.AI unreachable” — network error or the API changed shape. Run
ZAI_API_KEY=… node dev/test-raw.mjsto dump the raw responses; the parsing is defensive, so a changed field shows—rather than crashing.
Contributing
Contributions are welcome! There is no build step and no dependencies — the JS in the repo is exactly what runs. See CONTRIBUTING.md for dev setup, the validation checks, and conventions. Please note the Code of Conduct.
Good first areas: more time-window breakdowns, new platform support, locale/i18n, and UI polish.
Acknowledgments
msadofschi/claudetrack— the architecture this extension is modeled on (MV3 + alarms + auth-backoff + badge).guyinwonder168/opencode-glm-quota— the published plugin the monitor endpoints and response shapes were derived from.
License
MIT © GLM Usage Monitor contributors